 Jen HoldenLicense ID:639966
- +1(443) 803-7620 jen@thejenholdengroup.com
Annapolis, MD Housing Market: Current Prices, Trends, and Forecast

Updated on: November 2, 2026
By Jen Holden · Updated November 2026
The Annapolis, MD housing market is one of Maryland's pricier markets and is slowing rather than crashing.
Key Takeaway
Annapolis prices sit above the state median, and Maryland prices were still rising year over year in mid-2026. Published forecasts expect 30-year rates to stay above 7% through 2027, so waiting for cheaper borrowing is a weak plan. Buyers should budget at today's rate and negotiate on condition. Sellers should price to recent comparable sales and list a home that is ready to move into.
Who This Guide Is For
This guide is for buyers and sellers deciding whether and when to buy or sell a home in Annapolis, MD over the next year, including people relocating for state government, Naval Academy or Fort Meade work.
Related guides: New home developments in Annapolis, Investing in Annapolis, MD real estate, Downsizing in Annapolis, Average rent in Annapolis, Property taxes Annapolis, Average cost of a home in Annapolis, Build my own home in Annapolis, HOA fees Annapolis.
Annapolis Housing Market at a Glance
- Maryland median sale price: $455,000 in July 2026, up 2.2%.
- 30-year fixed rate: 7.24% on October 29, 2026.
- Fannie Mae projects 7.5% rates through all of 2027.
- A balanced market holds about 5 to 6 months of supply.
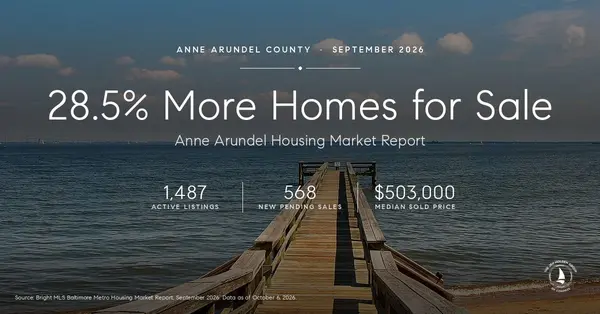
- Anne Arundel foreclosure events rose 22.9% year over year in Q2 2026.
Buyer's Market or Seller's Market? What the Numbers Show
Five monthly figures show which side has the stronger negotiating position in Annapolis:
- the median sale price and its change from a year earlier
- active listings
- months of supply
- median days on market
- the median sale-to-list ratio
Read them for the same month and from the same source, such as Bright MLS data published through Maryland REALTORS, so the figures line up.
Months of supply carries the most weight. It measures how long current listings would last at the current pace of sales if no new homes came on the market. Housing economists and NAR treat roughly 5 to 6 months as a balanced market. Below that, sellers hold the negotiating power: offers come in near or above asking, and buyers have little room to ask for repairs or credits. Above it, buyers gain bargaining power, because sellers compete for a smaller pool of offers.
Days on market and the sale-to-list ratio confirm the reading. Short market times and ratios at or above 100% point to sellers. Longer market times and ratios under list price mean buyers are negotiating prices down.
A market can shift toward buyers before it becomes a buyer's market. Homes taking longer to sell and inventory building are early signs of that shift. As long as prices keep rising and months of supply stays under about 5, sellers still have the advantage.
Current Home Prices and Market Speed
Track the Annapolis median month by month through the year, not as a single figure. A spring peak followed by easing in fall is a seasonal pattern. Prices that keep sliding into winter point to a softer market. Follow the median sale price rather than the average, because a few high-priced waterfront sales can pull the average well above what a typical home costs.
At the offer table, two numbers decide your approach: the share of homes selling above list price and the share of active listings with a price cut. When a large share sells above asking, bidding over list price on a well-priced, move-in-ready home is realistic. When price cuts are common, there is room to offer below asking or to request seller credits toward closing costs or repairs. That is especially true on homes that have passed the median days on market from the section above.
Buyers should secure their mortgage pre-approval before scheduling tours so they can submit an offer without delay. In a fast stretch, the pre-approval letter lets you act the same day. In a slower one, it shows a seller that your offer will close, which strengthens a below-asking bid.
Prices by Property Type and Area
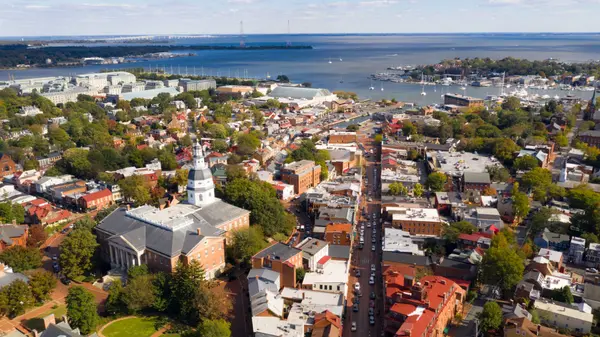
Annapolis housing runs from centuries-old brick structures to newer construction, and price follows type, age and water access. Census figures for Annapolis city (American Community Survey, 2023 five-year estimates) show 39.2% of units are single-family detached homes and 24.2% are attached row homes. Buildings with 5 to 19 units make up 8.8%, buildings with 20 or more units 10.7%, and 2 to 4 unit buildings 1.9%.
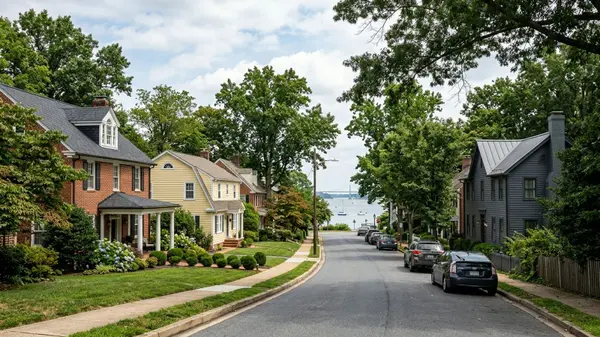
- Historic townhomes: Downtown attached brick homes from the 18th and 19th centuries, near Main Street, often without large yards or off-street parking.
- Waterfront properties: Homes along the Severn River and South River with private docks and views, at the top of the price scale.
- Single-family homes: Detached houses with larger lots, driveways and attached garages, farther from the city center.
Water frontage is the biggest single price driver. To see what it adds, compare recent waterfront sales against similar homes without frontage in the same ZIP code. The citywide median blends very different areas, and prices and price changes can vary widely between ZIP codes and neighborhoods. Judge a home against recent sales in its own area rather than against the city figure. Buyers researching different parts of the city can read our ultimate guide for Annapolis.
Age affects the budget as well as the price. About 20.6% of Annapolis housing units were built before 1970, including 15.7% built before 1940. Older homes are more likely to need roof, plumbing, electrical or foundation work. Set aside money for a full inspection and possible repairs before you settle on an offer amount.
Annapolis vs. the Maryland Housing Market
Annapolis sells above the statewide median, so a buyer moving from elsewhere in Maryland should expect to pay more here for a comparable home. Three levels are worth comparing for the same month:
- Annapolis, using the five monthly figures listed above
- Anne Arundel County
- Maryland as a whole
The latest statewide figures are:
- Maryland, July 2026: median sale price $455,000, up 2.2% from a year earlier, on 6,328 homes sold.
- Maryland, full year 2025: median sale price $431,000, up 2.6% from 2024.
Compare the Annapolis year-over-year change with the state's to see whether local prices are pulling ahead of Maryland or falling back toward it.
Annapolis Housing Market Forecast and Predictions
Four factors will shape Annapolis prices and sales over the next 6 to 12 months.
- Mortgage rates: Freddie Mac's 30-year fixed rate averaged 7.24% on October 29, 2026, down from 7.32% a week earlier. Fannie Mae's October 2026 forecast expects the rate to average 7.4% in the fourth quarter of 2026 and 7.5% in every quarter of 2027. The Mortgage Bankers Association's October 2026 forecast puts it near 7.3% at the end of 2026 and above 7% through 2027.
- Supply: New listings compared with a year earlier show whether inventory is building. Months of supply, covered above, shows whether that inventory is shifting negotiating power to buyers.
- Seasonality: Listings and sales follow the calendar, so the month you list or shop affects how many homes you compete with.
- Local demand: State government, the U.S. Naval Academy and Fort Meade relocations bring a steady stream of buyers, along with commuters using US-50 to Washington, D.C. and I-97 to Baltimore.
- The job picture has softened. Anne Arundel County's seasonally adjusted unemployment rate was 4.1% in November 2025, up from 2.7% a year earlier.
- Monthly state reports use a different series. They put the rate at 3.8% in January 2026, 4.3% in February 2026 and 3.4% in June 2026.
- Rising unemployment thins the pool of buyers who can qualify for a mortgage. That can slow sales even while prices keep rising.
Two developments would change this outlook. Rates falling faster than forecast would bring more buyers back and support prices. A sharp jump in new listings would give buyers more bargaining power.
Will the Annapolis Housing Market Crash?
Current data point to a slower market rather than a crash. Crashes come from forced selling combined with a glut of homes for sale. Price drops spread when many owners must sell at once and buyers have far more choice than usual.
- Supply: Check Annapolis months of supply against the balanced benchmark. A crash needs inventory well above that range.
- Forced selling: Maryland DHCD recorded 306 foreclosure events in Anne Arundel County in Q2 2026, 6.8% of the statewide total and up 22.9% from Q2 2025. Notices of default reached 88, up 37.5% from a year earlier but down 38.5% from Q1 2026. That rise is worth watching, though it has not stopped statewide prices from climbing.
- The last downturn: Maryland single-family prices peaked in late 2006 and fell 20.6% to their trough, based on the FHFA index.
Flat or slightly lower prices in a slow season do not make a crash. A crash shows up as sustained, broad price declines driven by distressed sales.
What This Market Means for Buyers and Sellers
For Buyers
- Homes inside Annapolis city limits pay a city property tax on top of the Anne Arundel County rate, so check which side of the line an address sits on before budgeting.
- School assignment within Anne Arundel County Public Schools varies by address, so verify it for each property.
- Maryland runs first-time buyer down payment and loan programs worth checking before you make an offer.
Buying Now or Waiting
Waiting has costs: rent paid in the meantime and any price increases, with Maryland's median still rising year over year.
To run the rent-versus-buy test, compare two monthly figures:
- your current rent, or the median asking rent for a similar home
- the full monthly cost of owning: principal and interest at today's average rate, county and any city property tax, insurance, and upkeep
Buying now makes sense if your job is stable, you plan to stay several years, and the payment fits at today's rate.
For Sellers
- Price to recent comparable sales, not to last spring's peak.
- Make the home move-in ready. Homes that need extensive renovations often sit longer, and buyers calculating payments at current rates avoid immediate major repairs.
- Time the listing for the months when buyer activity is strongest.
- Use the sale-to-list ratio to set the asking price. When homes sell under list, pricing above the market invites cuts later.
Frequently Asked Questions
What Is the Cost of Living in Annapolis, Maryland?
Housing is the largest cost, whether you buy at the local median sale price or rent at the median asking rent. Utilities, transportation, and the combined city and county property taxes add to the monthly total.
Is Annapolis a Good Place to Buy a Home for Retirement?
Condos and townhomes offer lower-maintenance options. Downtown historic homes often lack off-street parking and have several flights of stairs.
Are Homes Cheaper in Edgewater or Arnold Than in Annapolis?
Edgewater (21037) lies south across the South River, and Arnold (21012) lies north across the Severn River. Compare their sold medians over the last 12 months with the Annapolis median for the same period. Both are outside Annapolis city limits, so they skip the city property tax, which lowers the monthly cost even at a similar price.
How Much Have Annapolis Home Prices Changed Since 2021?
Compare the 2021 full-year Annapolis median with the current median from the same source to see the change. Owners who bought in 2021 and are weighing a sale should compare their purchase price with recent comparable sales. Then factor in the cost of buying their next home at current rates.
Sources
- Maryland REALTORS housing statistics: July 2026 and 2025 annual figures
- Freddie Mac Primary Mortgage Market Survey, October 29, 2026
- Fannie Mae and MBA mortgage rate forecasts, October 2026
- Anne Arundel County at a Glance, Maryland Department of Labor data, January 2026
- Maryland DHCD Property Foreclosure Events, Q2 2026
- Maryland Department of Planning, FHFA All-Transactions House Price Index
- Annapolis housing stock, American Community Survey 2023 five-year estimates
- What is a balanced housing market
Categories
Recent Posts